Using test coverage in Go
Table of Contents
Test coverage is a way to measure which source lines were covered by unit
tests. Go provides built-in support for getting a percentage of test coverage
by running with the -cover flag, which will display the test coverage for
every package. If the result is 100%, all lines were executed in tests.
$ go test -cover ./...
ok      github.com/akupila/recorder     0.309s  coverage: 88.3% of statements
Is 88.3% good? Why? Why not? What does this number tell us, except that there are at least some tests here?
Coverage targets #
Some companies attempt to set minimum coverage requirements. They may aim for 80%+ test coverage, and anything less fails the build. A higher number is generally better, but a high number isn’t the only thing we should be aiming for.
Managers who don’t know how to measure what they want settle for wanting what they can measure.
Notably, this incentivizes the developer to increase coverage, by whatever means possible. This can lead to:
- Blindly using the number as a target. A higher number doesn’t automatically give more confidence in the correctness of the code. It’s often easier to add tests for trivial things. This gets the coverage high (enough), so the important - but less trivial things - are left untested.
- Finding artificial ways to execute code paths, such as error cases. This leads to mocking the file system or other low level details, which makes the code more difficult to read and maintain. Or, even worse, if the source of the error can’t be mocked…
- ..ignoring errors that are difficult to trigger. If we ignore the error, we
don’t have
if err != nillines to test. Test coverage increases, while the code quality decreases.
In addition, this can easily lead to testing internal implementation details of unexported functions, because that’s likely where most of the code lives. This ties the tests to the implementation and makes the implementation more difficult to change. Code coverage only looks at what lines were covered, not what part of the public API is covered.
Not all code is equal either. Some code may be very important to the business so it must be well tested, maybe even forcing the obscure error cases, while others can be more-or-less ignored. A test coverage tool won’t know the difference. By only focusing on the number, we end up simplifying the problem a bit too much and lose sight of why we have tests in the first place.
Coverage tools in CI #
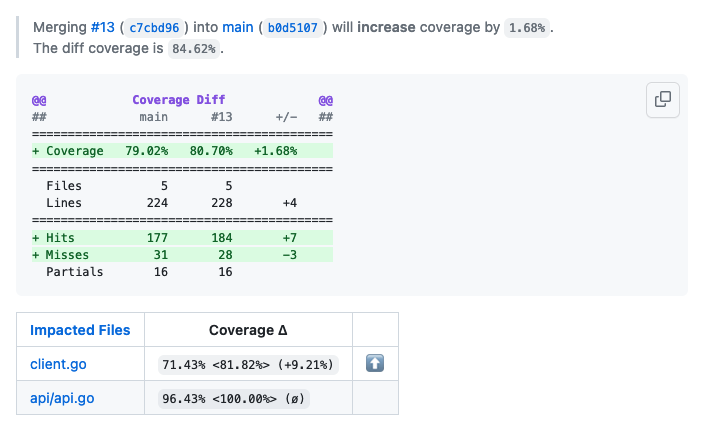
I used to advocate for test coverage tools in CI, such as Codecov or Coveralls. These tools work well and are quite easy to integrate into CI, but what value do they bring? The PR gets a comment of what coverage changed. What am I, as a reviewer, supposed to do with “coverage increased up by 1%”?
This can be disabled, but it’s enabled by default.
Tools like these may also be used for viewing coverage by line and add tests for lines that were missing. The idea is good, but this is very slow because we need to push our changes to some branch and wait for CI to run. As a result, the coverage is probably not looked at, so we end up losing the signal while keeping the noise.
Using test coverage during development #
So, how can we use test coverage to provide value? In strict TDD, tests are written before the implementation, but in a more general sense we should make sure the code is well tested before we submit it for review. At least I end up going back and forth a bit and some tests may be missing when I’m done with the implementation.
In addition to a number, Go can also generate a coverage report, which can be viewed in a browser:
$ go test -coverprofile=cover.out
$ go tool cover -html=cover.out
This is a bit cumbersome (and leaves a temp file behind), so I have this in my zsh config:
function gocover () {
  FILE=$(mktemp)
  go test -coverprofile=$FILE $@
  go tool cover -html=$FILE
  rm $FILE
}
With this, we can run gocover (whole project) or gocover ./somepkg
(specific package) to quickly get a coverage report for what we’re working on.
The web page that opens up shows our WIP code. We can review it and add tests
to cover the places that are missed but important to cover. This is quick
enough that we can frequently check the coverage, which gives us a quick
feedback loop and leaves us in a good place when we’re ready.
Some if err != nil lines may be ignored in tests; we can just verify that
that error is handled in a reasonable way. At least we are reviewing the code
and consciously accept that the lines aren’t covered in tests. An example could
be os.UserHomeDir, where it may be OK to not have that covered by tests, but
we still don’t want to ignore the error if it happens, so we’re OK with seeing
red lines on the returned wrapped error.
A side effect of this is that it also provides a quick self-review. The fact that it looks different than your editor almost gives a 3rd person view of the code, which itself can be useful, even outside of tests. Maybe you notice that something should have a better comment somewhere, which you missed in your comfortable editor.
Practical example #
As an example, I looked at an older project, which i haven’t touched in several years: recorder. If we run run coverage here, we can see this:
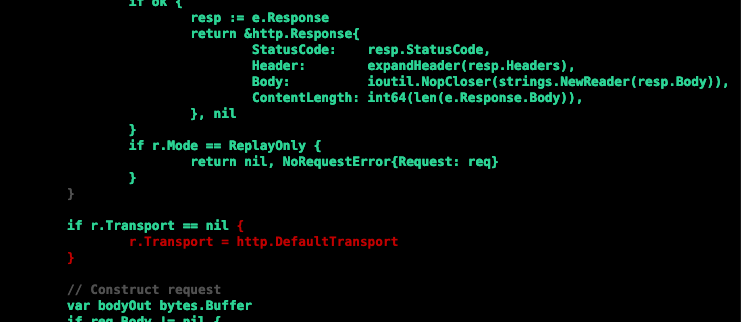
Looking at this, we can see that no test is checking for the fallback to
http.DefaultTransport. This should probably be tested (and documented).
On the other hand, we also see this:
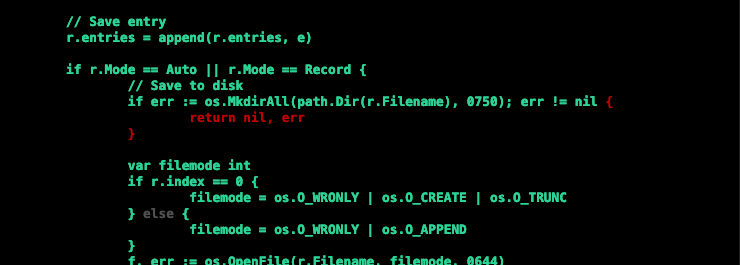
In this case, I’d say it’s OK to not have the os.MkdirAll covered by tests. We can verify that at least the error is returned, although we may want to wrap it.